Ziel mir keng! – Science CheckClimate change in Luxembourg

science.lu/FNR
What are the effects of climate change on heavy rainfall, droughts, temperatures, the number of days and nights of extreme heat and the volume of rain and snow? A science check by the science.lu team of the Luxembourg National Research Fund.
„Ziel mir keng“: Climate change in Luxembourg
What are the effects of climate change on heavy rainfall, droughts, temperatures, the number of days and nights of extreme heat and the volume of rain and snow?

Did you know that each month from June 2023 to May 2024 has been the warmest globally since records began? (The data cited in this article cover the period up to mid-2024!)
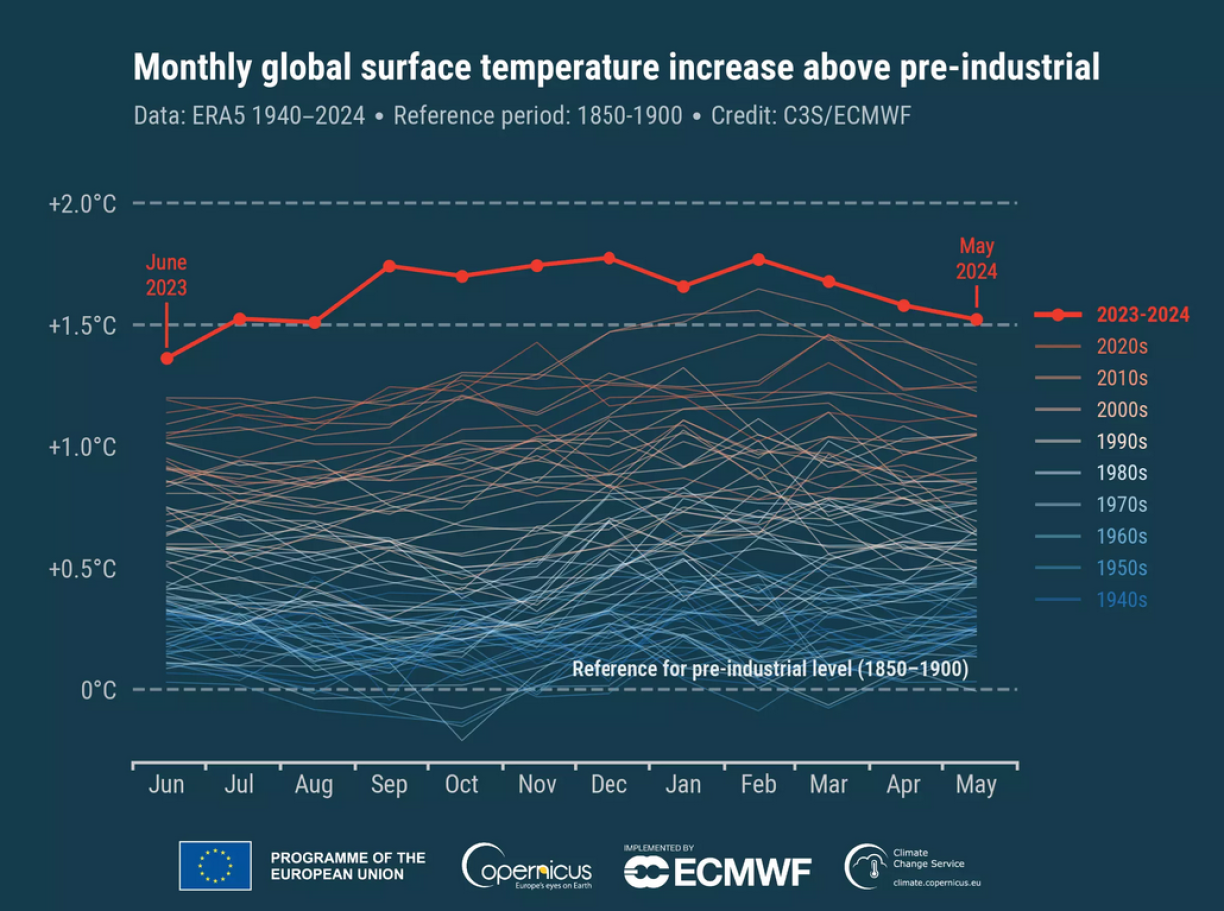
Figure 1: Monthly global surface air temperature anomalies (°C) relative to 1850-1900 from January 1940 to May 2024, plotted as time series for all 12-month periods spanning June to May of the following year. The last 12 months (June 2023–May 2024) are shown with a thick red line while all other years with thin lines shaded according to the decade, from blue (1940s) to brick red (2020s). Data source: ERA5.

What’s more, according to the IPCC, this one-year period was the warmest in at least 125,000 years.

Figure 2: Earth's average temperature has increased by more than 1 degree Celsius (1.8 F) from the preindustrial baseline. This new climate state will very likely persist for centuries as the warmest period in more than 100,000 years. The chart shows different reconstructions of temperature over time, with measured temperatures since 1850 and a projection to 2300 based on an intermediate emissions scenario. D.S. Kaufman and N.P. McKay, 2022, published datasets provided by D.S. Kaufman in “The Conversation”.
Figure 2: Earth’s average temperature has increased by more than 1 degree Celsius (1.8 F) from the preindustrial baseline. This new climate state will very likely persist for centuries as the warmest period in more than 100,000 years. The chart shows different reconstructions of temperature over time, with measured temperatures since 1850 and a projection to 2300 based on an intermediate emissions scenario. D.S. Kaufman and N.P. McKay, 2022, published datasets provided by D.S. Kaufman in “The Conversation”.
Infobox

How can this be? It is not always warm in Luxembourg after all!

Yes, but here we’re talking about worldwide averages. When it comes to climate change, we need to remember two things:

  • First, don’t confuse global climate with local climate.
    • Even if it isn’t super warm here, it can still be the hottest month worldwide.
  • And second, weather and climate are not the same thing.
    • While weather describes the meteorological conditions as they currently are outside, measuring climate change requires you to compare weather averages over long periods of time. At regional level, it is best to compare 30-year periods. Globally, you can also compare shorter periods of 20 or at least ten years.

That means, if one year is extremely hot or extremely cold, that is not direct evidence of climate change. But if, for example, the years 1961-1990 were significantly colder or warmer than the years 1991-2020, and a trend is observable over many years, then that is climate change.

In this episode of ‘Ziel mir keng!’, we will briefly touch on the global trends, before moving on to a more targeted analysis of a few physically measurable effects of climate change here in Luxembourg.

What do you think? Has it got warmer in Luxembourg since industrialisation? Is there more rain? Are there more droughts?

In this episode of Ziel mir keng!, we examined climate change in detail with the help of Andrew Ferrone from the Ministry of Environment, who is also Luxembourg’s representative on the Intergovernmental Panel on Climate Change (IPCC).
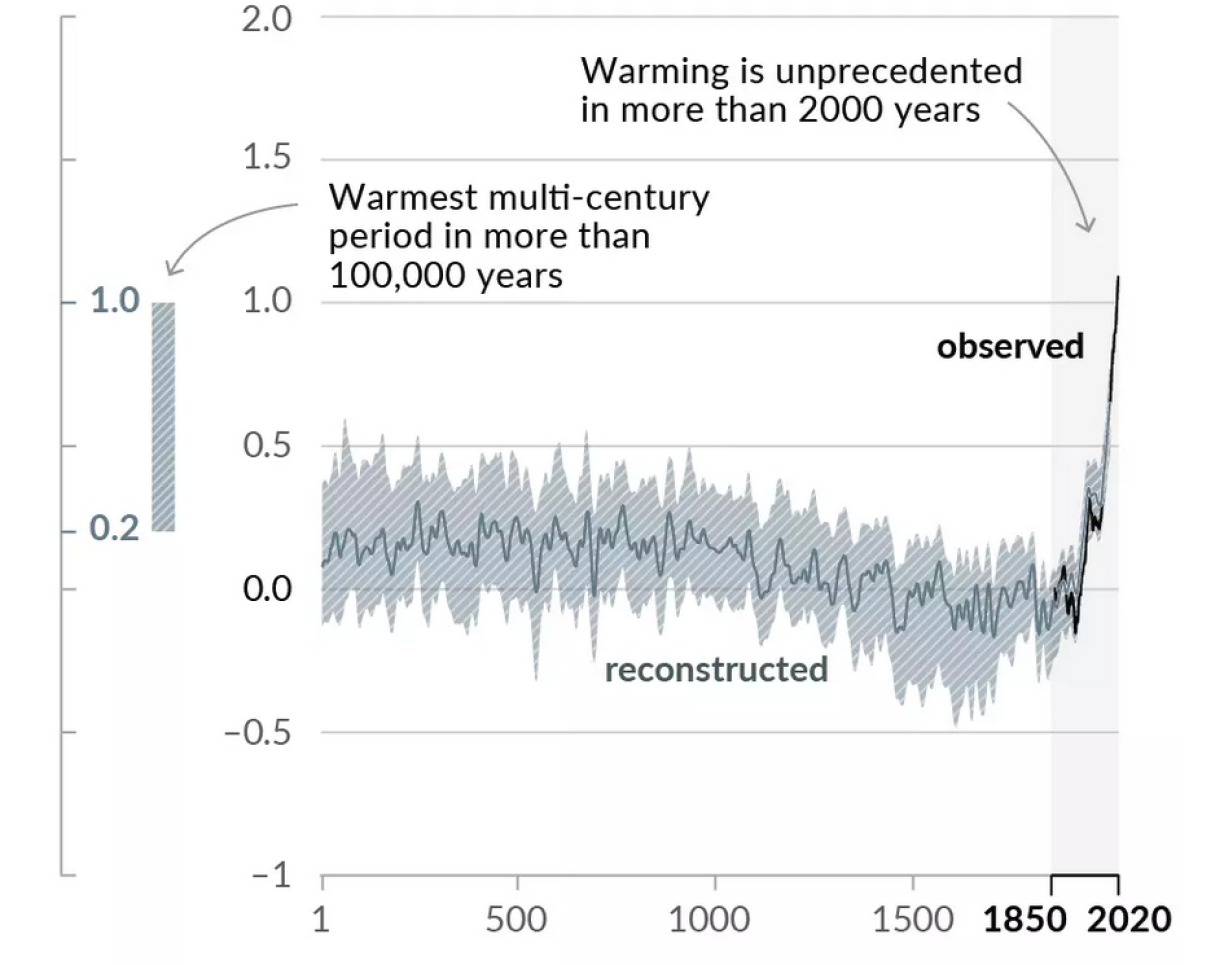
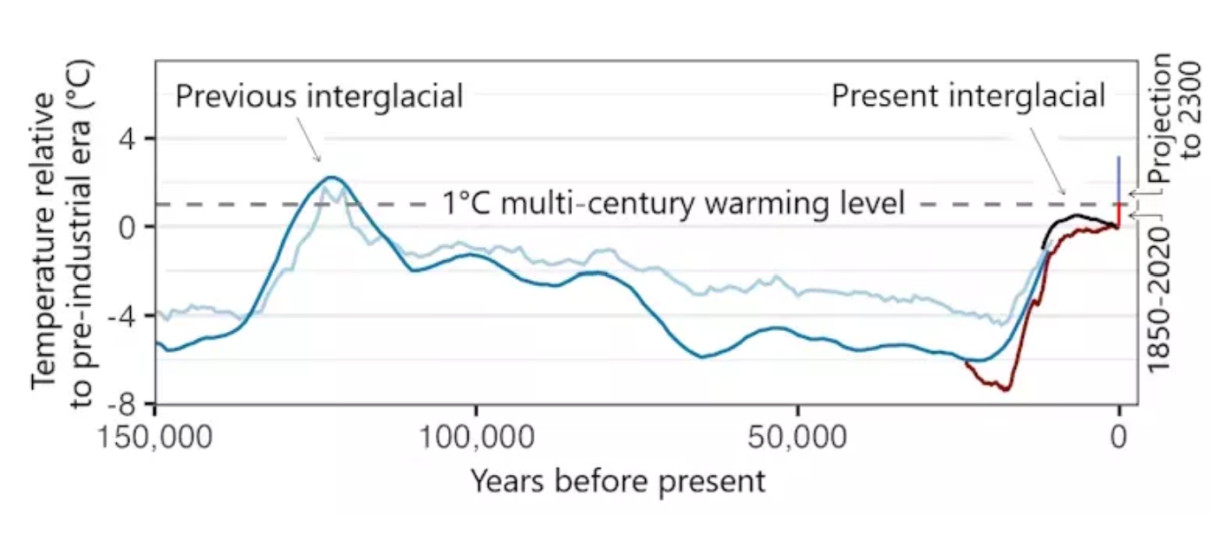
How have temperatures evolved around the world?

Figure 3: Changes in global surface temperature reconstructed from paleoclimate archives (solid grey line, years 1–2000) and from direct observations (solid black line, 1850–2020), both relative to 1850–1900 and averaged by decade. The vertical bar on the left shows the estimated temperature (very likely range) during the warmest multi-century period in at least the last 100,000 years, which occurred around 6500 years ago during the current interglacial period (Holocene). The last Interglacial, around 125,000 years ago, is the next most recent candidate for a period of higher temperature. These past warm periods were caused by slow (multi-millennial) orbital variations. The grey shading with white diagonal lines shows the very likely ranges for the temperature reconstructions.

Let’s first look at global temperatures over the last 2,000 years. It can be observed that it has become rapidly and continuously warmer since industrialisation. That is unprecedented for this period.

And yes, there is a strong consensus in the scientific community that the current climate change is caused by humans.

According to a study, in over 99% of the publications on climate change that have been published in peer-reviewed journals since 2012, scientists agree that climate change is caused by humans.

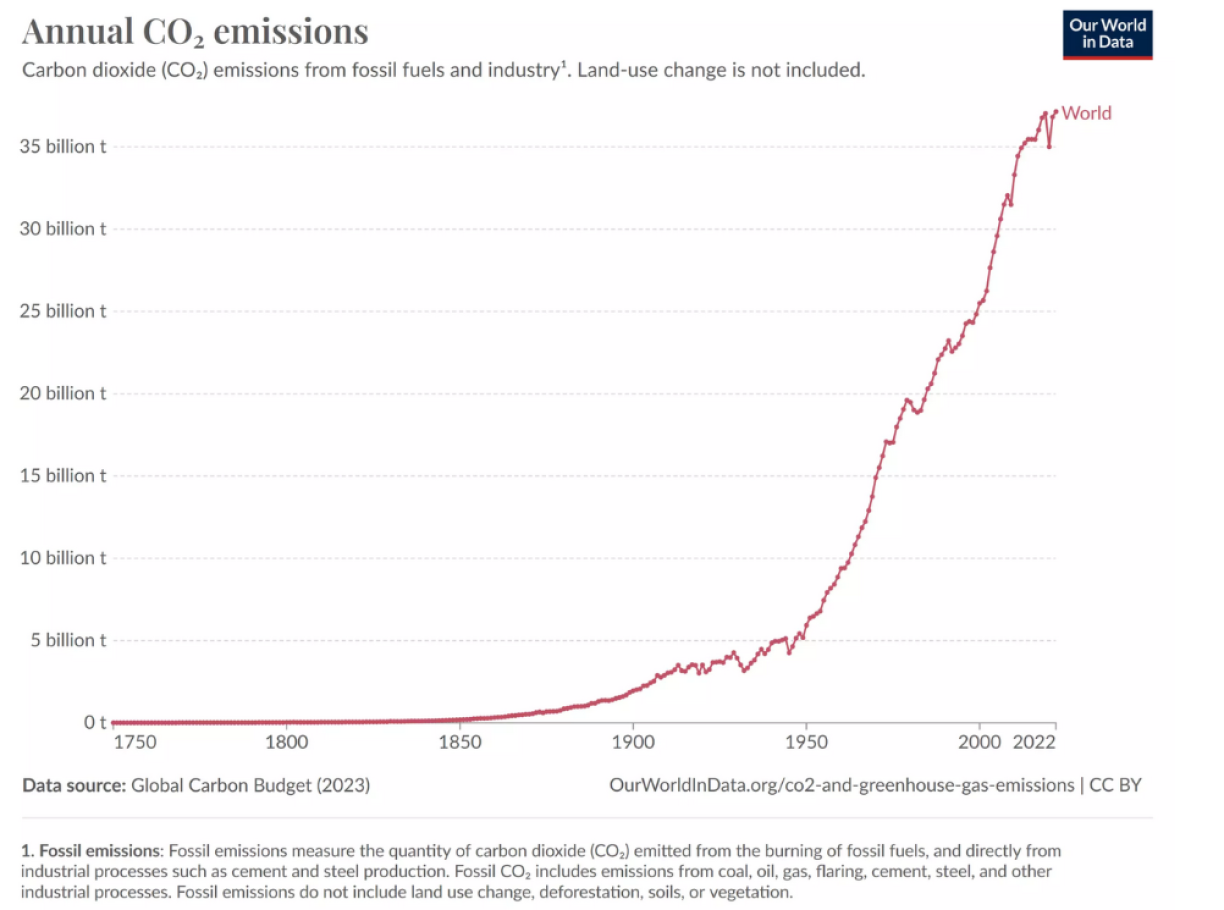
The physics behind how CO 2 and other greenhouse gases warm the climate has been understood for a long time and can now also be modelled with relative accuracy. And there’s no denying that we humans have released a lot of CO 2 into the atmosphere since industrialisation. The CO 2 content is currently higher than it has ever been in the last 2 million years.

Figure 4: Annual CO2 emissions. Carbon dioxide (CO2) emissions from fuels and industry. Land-use change emissions are not included.

By the way, this is a model from the IPCC showing how climate change would have progressed without human influence.

Figure 5: Changes in global surface temperature over the past 170 years (black line) relative to 1850–1900 and annually averaged, compared with Coupled Model Intercomparison Project Phase 6 (CMIP6) climate model simulations of the temperature response to both human and natural drivers (brown) and to only natural drivers (solar and volcanic activity, green). The solid coloured lines show the multi-model average, and the coloured shadows show the very likely range of the simulations.
© IPCC

How have temperatures evolved in Luxembourg?

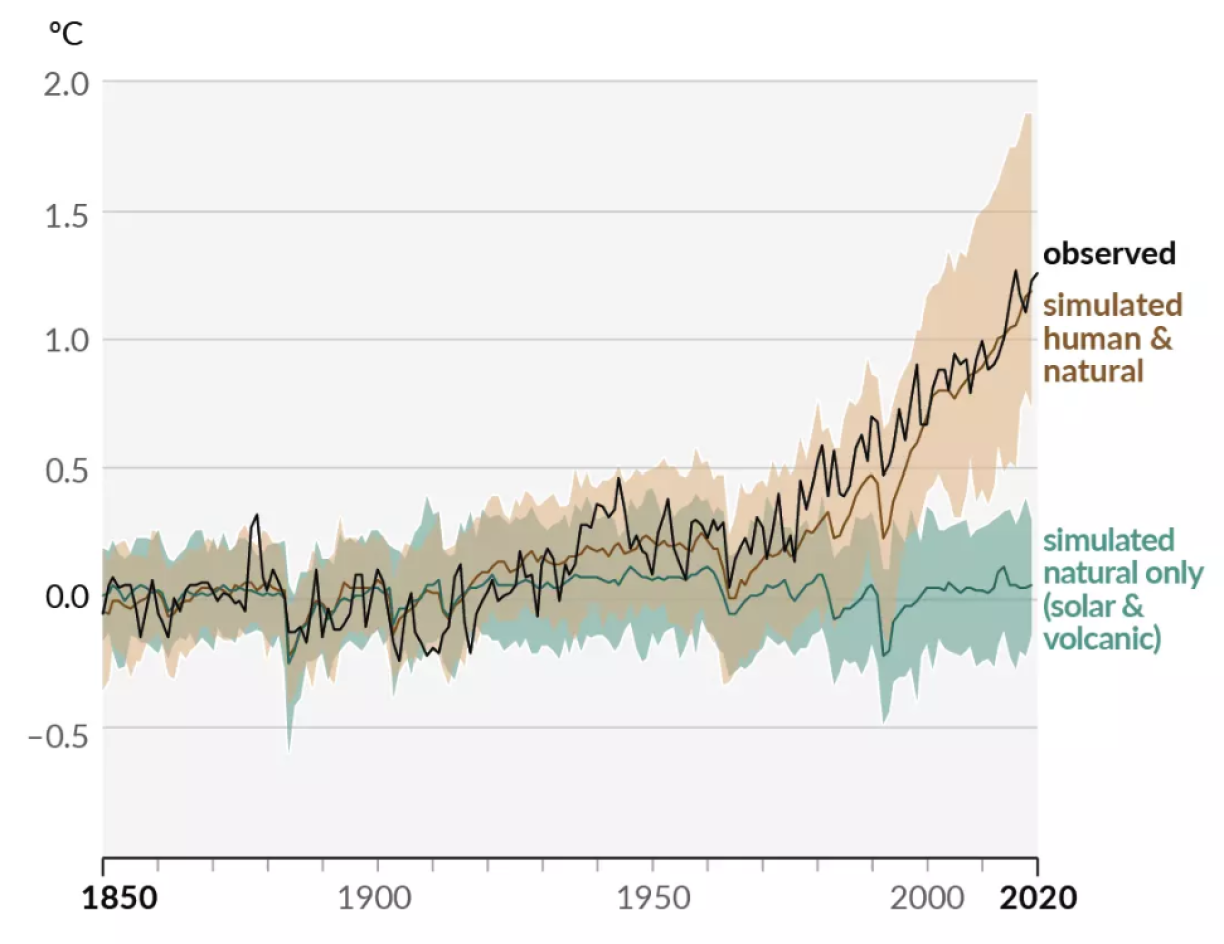
Even though it is getting warmer worldwide, there are regional differences. In some regions, it gets warmer than average and in others less.

What’s more, temperature increases over the continents are higher than those over the oceans.
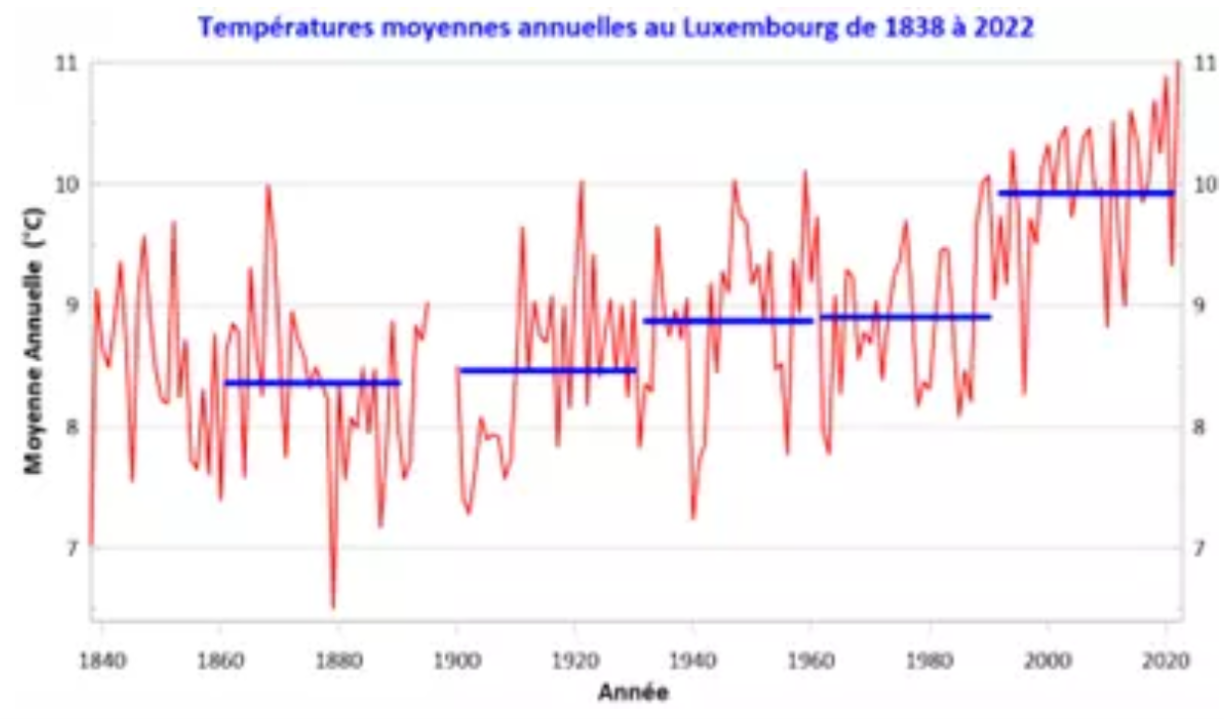
Infobox

Figure 6: Average annual temperatures in Luxembourg (1838–2022).
© Meteorological Service, Administration of Technical Agricultural Services (ASTA)

Let’s now take a look at temperatures in Luxembourg. Has it got warmer here?

Yes, it has. This graph shows that temperatures have increased continuously over the various 30-year cycles. In Luxembourg, the 1990-2020 cycle was 1.6 °C warmer than the 1860-1890 cycle.

In comparison, worldwide it has become 1.1 °C warmer in the same period. If we exclusively look at warming over the continents, the increase is 1.6 °C. Warming here in Luxembourg is thus almost identical to global warming over the continents.

Additionally, the ten warmest years in Luxembourg since records began all occurred between 2003 and 2023 (the data cited in this article cover the period up to mid-2024!).
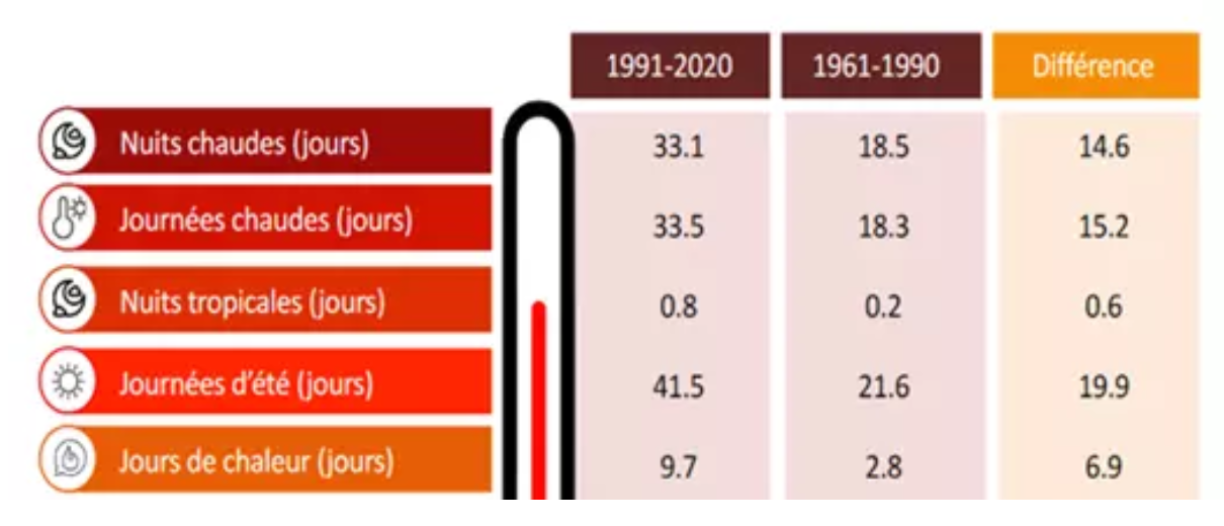
How has the number of hot days and nights evolved in Luxembourg?

Let’s now compare the number of extremely hot days and nights.

Between 1991 and 2020, compared with the previous 30 years, the number of so-called heat days, i.e., days on which maximum temperatures exceeded 30 degrees, increased from 2.8 days per year to 9.7. So, more than three times as many.

The number of days that qualify as ‘summer days’, and nights that qualify as ‘warm’, has almost doubled.

Infobox

Number of summer days and heatwave days, as well as warm nights and tropical nights in Luxembourg, 1991–2020 vs 1961–1990
© Meteorological Service, Administration of Technical Agricultural Services (ASTA)

Maybe it’s not such a bad thing if temperatures increase here in Luxembourg?

Well, unfortunately, there are also negative consequences.

Have heavy rainfall events increased in Luxembourg?

What about, for example, the impact of warming on heavy rainfall in Luxembourg?

Figure 8: Number of days with various precipitation amounts in Luxembourg in summer (top) and in winter (bottom), for the periods 1991–2020 and 1961–1990.
© Meteorological Service, Administration of Technical Agricultural Services (ASTA)

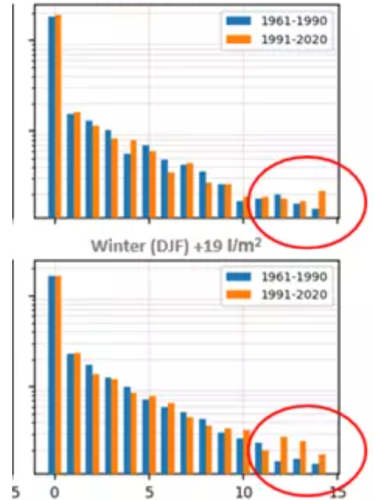
If we compare the same period, then the number of days with heavy rain has increased significantly in both winter and summer, by five days each.

Physics can help us understand why there is an increase in heavy rainfall when global temperatures rise. As the air gets warmer, it can store 7% more water in the form of water vapour with each degree. This was proved as early as the 19th century by physicists Emile Clapeyron and Rudolf Clausius.

Furthermore, more water also evaporates from the oceans when it is warmer.

So climate change increases the likelihood of heavy rain events – and also the risk of flooding, unfortunately.

Again, there have been floods in the past. And yes, floods are partly due to surface sealing – but also to heavy rain events. Not every single flood can be attributed to climate change. But the probabilities are increasing, and such events are becoming more frequent.

But what about droughts?

Has the number of droughts in Luxembourg increased?

Interestingly, when we compare the same time periods, the number of droughts in Luxembourg also increased.

Measuring drought is more complex than heavy rainfall, because different factors need to be considered, such as precipitation over a longer period, soil moisture, sunshine duration, and so on. To do this, researchers work with a drought index.

Figure 9: Drought index in Luxembourg for the periods 1991–2020 and 1961–1991.
© Meteorological Service, Administration of Technical Agricultural Services (ASTA).

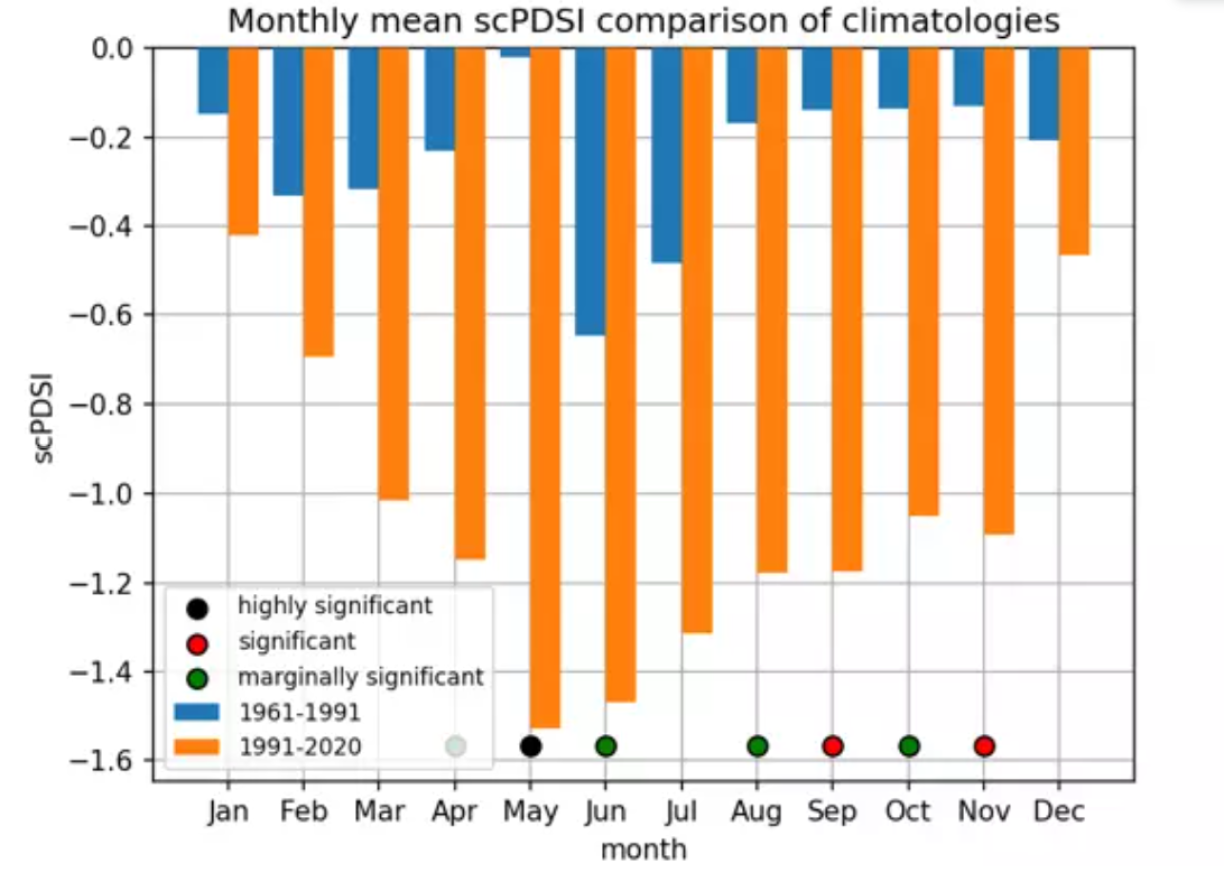
The higher the value of that index, the more droughts will occur. Between 1961 and 1990, droughts occurred almost exclusively in June and July. In the 30 years following, this had already expanded to every month except January and December, where the risk remains very low.

Our farmers, horticulturalists, and gardeners can tell you a thing or two about it.

The drought index is an index of probability. It determines the likelihood, or in other words, the frequency, of droughts occurring. These probabilities were never zero, but they are now significantly increasing.

But now what about the overall rainfall amounts here in Luxembourg?

What is the impact of climate change on precipitation in general in Luxembourg?

Well, the average precipitation quantities have remained relatively consistent over the years.

Figure 10: Average annual rainfall (l/m2) in Luxembourg 1920–2022.
© Meteorological Service, Administration of Technical Agricultural Services (ASTA)

But it is evident that the seasons are changing.

Winters have become significantly wetter, with an increase of 19 litres of rainfall per square metre, when comparing 1960-1990 with 1990-2020. Meanwhile, springs have become significantly drier, with a decrease of 26 litres per square metre.

In the case of summer and autumn, however, we do not see any significant differences.

And finally, let’s take a look at the number of days of snow.

Impact of climate change on snow in Luxembourg

Between 1961 and 1990, there was an average of 41.4 days per year with at least 1 centimetre of snow in Luxembourg. In the 30 years afterwards, this number dropped to only 25 days (source: Meteolux). We thus have significantly fewer days of snow nowadays.

Conclusion

  • Yes, temperatures in Luxembourg are rising, so far by around 1.6 °C, compared with pre-industrial times.
  • Yes, the number of days and nights that are considered warm, summery or tropical is also increasing.
  • No, average precipitation quantities have hardly changed. But what has changed is that we have more extreme weather events. On the one hand, more heavy rain events, on the other hand, more droughts.
  • And yes, we have less snow.
© science.lu/FNR/SKIN

In this episode, we have only talked about the measurable physical effects of climate change in Luxembourg. But climate change naturally also has an impact on agriculture, biodiversity, our well-being, and social cohesion. But that’s for another episode!


Ziel mir keng! is broadcast on Sunday evenings after the programme Wëssensmagazin Pisa on RTL Tëlee and is a collaboration between RTL and the Luxembourg National Research Fund. You can also watch the episodes on RTL Play.

Author: Jean-Paul Bertemes (FNR)

Editing: Michèle Weber (FNR)

Presentation: Jean-Paul Bertemes, Michèle Weber (FNR)

Peer review and advice: Andrew Ferrone (Ministry of the Environment; at the time the article was being prepared: ASTA)

Data and graphics: ASTA/Andrew Ferrone; Meteolux/Luca Mathias

Translation: Nadia Taouil (www.t9n.lu)

Infobox: Sources

Back to Top
CIM LOGO